
Time Domain vs. Frequency Domain Analysis: Two Views of the Same Machine
Representation of a vibration waveform
The sensor is installed. The machine is running. A vibration reading appears on the screen.
Now comes the harder question: What is the machine trying to tell you?
An increase or decrease in vibration level may indicate that machine condition is changing, but an overall value rarely explains the cause by itself. Is the problem unbalance, misalignment, looseness, a developing bearing defect, or something else?
That is where time-domain and frequency-domain analysis become valuable. They examine the same vibration signal from different perspectives. The time domain shows what the vibration is doing over time. The frequency domain helps reveal which machine behaviors are contributing to it. Neither view tells the entire story on its own. Used together, however, they can turn a changing vibration signal into a much clearer maintenance decision.
Time-Domain Analysis: Seeing Vibration as It Happens
Time-domain analysis displays vibration amplitude against time. The resulting time waveform shows how the measured motion changes from one moment to the next. Depending on the sensor and monitoring arrangement, the signal may be expressed as acceleration, velocity, or displacement. Maintenance teams can also use calculated values such as overall amplitude, peak to peak amplitude, peak amplitude and root mean square (RMS) to assess machine condition.
The biggest strength of the time domain is immediacy. It helps answer practical questions such as:
- Is the overall vibration level changing?
- Did the vibration change during startup or shutdown?
- Is the signal steady, repetitive, impulsive, or irregular?
- Did an unusual event occur at a specific point in time?
- Is the machine behaving differently from its established baseline?
For routine condition monitoring, these observations can be extremely useful. A technician does not always need a complete diagnostic study to recognize that a machine’s behavior has changed. A clear upward or downward trend or a sudden waveform event change may provide enough information to initiate an inspection.
Time-domain information is therefore well suited to general condition trending, baseline comparisons, transient-event monitoring, and fast field assessments. It provides a relatively direct picture of machine behavior without requiring every component of the signal to be separated and identified.
Where the Time Domain Reaches Its Limit
A time waveform can show that something unusual is happening, but it may not clearly identify the source.
Most machines generate vibration from multiple components simultaneously. A motor, coupling, shaft, bearings, gears, fan, or pump impeller may each contribute energy to the signal. Those contributions overlap in the time waveform, making different faults appear similar when viewed only as an overall level.
Consider a machine with an elevated vibration reading. The increase might be associated with unbalance, misalignment, looseness, or a bearing-related condition. The time-domain trend raises the warning, but additional analysis may be required before maintenance can determine where to look. That is when the frequency domain becomes especially useful.
Frequency-Domain Analysis: Separating the Signal
Frequency-domain analysis reorganizes the vibration signal according to frequency rather than time. A Fast Fourier Transform, or FFT, converts the time waveform into a vibration spectrum containing individual frequency components. Instead of seeing one complex signal, the analyst sees a series of peaks. The location and amplitude of those peaks can then be compared with running speed, known component frequencies, harmonics, sidebands, and other characteristics of the machine.
This makes the frequency domain particularly valuable for answering a different set of questions:
- Is the vibration concentrated at running speed?
- Are harmonics present?
- Does the pattern correspond to a known bearing frequency?
- Are sidebands appearing around a dominant frequency?
- Are multiple machine conditions contributing to the overall reading?
The spectrum does not automatically diagnose the machine. The analyst still needs to consider equipment design, operating speed, load, sensor location, measurement direction, and operating history. Nevertheless, separating the signal into frequency components makes patterns visible that may be difficult to recognize in a time waveform.
Frequency-domain analysis is commonly used when a fault is suspected, when an overall reading has increased without an obvious explanation, or when the maintenance team needs to distinguish between possible fault types. It can also help detect developing conditions before they create a dramatic increase in overall vibration.
One Signal, Two Different Questions
The difference between the two methods becomes easier to understand when they are framed around the questions they answer.
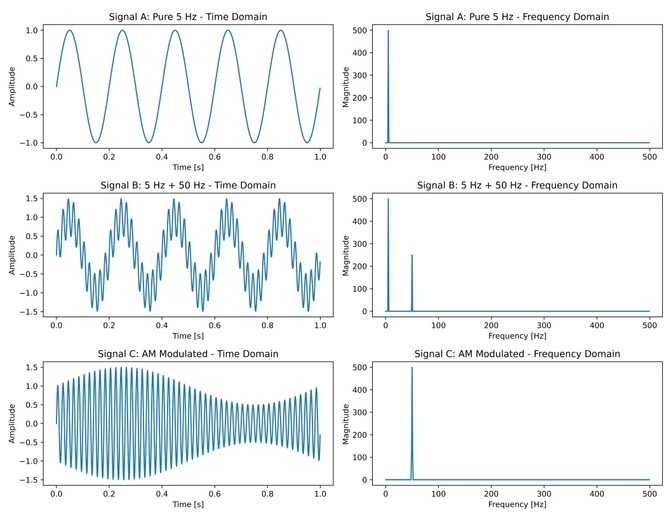
Time Domain vs. Frequency Domain Analysis & Comparison
Time-domain analysis asks:
What happened to the vibration signal, and when did it happen?
Frequency-domain analysis asks:
What frequencies are present, and what machine behavior may be producing them?
Imagine that a pump’s overall vibration begins to rise. The time-domain trend shows that the change started recently and is continuing. That information helps determine whether the condition is stable, worsening, or associated with a particular operating event. The frequency spectrum then shows where the vibration energy is concentrated. A dominant peak, a series of harmonics, or another repeatable spectral pattern provides additional evidence for the investigation. The first view draws attention to the change. The second helps explain it.
When Time-Domain Analysis Is Most Useful
Time-domain information is often the most practical starting point when:
- The goal is to monitor overall machine condition.
- Fast, easily interpreted readings are needed.
- Measurements are being compared with an established baseline.
- Startup, shutdown, impact, or other transient behavior is important.
- The asset has relatively predictable operating conditions.
- The immediate question is whether the machine’s behavior has changed.
In these situations, the speed and simplicity of the time-domain view can help a maintenance team recognize developing problems without unnecessarily complicating the initial assessment. For example, in the picture above, one can easily see the 50 Hz frequency in the AM Modulated case. You can see that the spectrum does not show the 1 Hz modulating frequency that is present. In an induction motor scenario, where is this 1 Hz modulating frequency coming from? In an induction motor the running speed of the rotor is less than the line frequency, and this is called slip. The slip frequency can modulate the waveform. The spectrum does not show the low frequency because the spectrum analyzer does not have the resolution needed to view the slip frequency. This is why you always look at the time domain and the frequency domain together to make sure that you do not miss anything.
When Frequency-Domain Analysis Adds More Value
Frequency analysis becomes especially important when:
- A vibration level has increased, but the cause is unclear.
- Similar fault conditions need to be distinguished.
- Harmonics, sidebands, or component-related frequencies must be evaluated.
- Early bearing or gear-related indications are being investigated.
- The machine produces a complex combination of vibration sources.
- Maintenance needs more diagnostic evidence before planning corrective work.
Compared with an overall trend, the spectrum requires more context and interpretation. But when a team needs to move from “the vibration is increasing” to “this is where we should investigate,” that additional detail can be decisive.
Why the Best Strategy Uses Both Methods
Treating time-domain and frequency-domain analysis as competing approaches misses their real value. They work best as complementary layers of the same monitoring strategy.
Time-domain data provides the broader condition picture. It shows trends, changes, peaks, impacts, and transient events. Frequency-domain analysis adds diagnostic resolution by separating the signal into components that can be compared with known machine behavior.
A practical workflow might look like this:
-
-
- An overall vibration value or time trend indicates a change.
- The time waveform is reviewed for impacts, irregular motion, or transient behavior.
- The spectrum is examined for dominant frequencies, harmonics, or sidebands.
- The results are compared with machine speed, construction, operating condition, and maintenance history.
- The team determines whether to continue monitoring, inspect the machine, or plan corrective work.
-
This layered approach helps prevent two common mistakes: reacting too quickly to a single overall reading or overlooking an emerging problem because the total vibration level still appears acceptable.
Building the Right Monitoring Approach
Not every asset requires the same depth of analysis.
For balance of plant equipment, overall vibration monitoring and alarm thresholds may provide an appropriate level of protection. For critical or essential machines, higher levels of monitoring are often required. Access to dynamic vibration signals allows technicians and analysts to perform deeper local analysis when the operating condition warrants it.
The Metrix MX5000 Sensor Interface Module accepts inputs from accelerometers, velocity sensors, proximity probe systems, and process sensors. It provides a proportional 4–20 mA output as well as access to the dynamic input signal through a BNC connection for local analysis. Each of its four channels can be configured independently, allowing the monitoring arrangement to be matched to the machine and measurement objective.
That flexibility supports a practical monitoring philosophy: continuously track the measurements needed for machinery protection and make dynamic data available when deeper analysis is required.
Frequently Asked Questions (FAQ)
Can technicians use time- and frequency-domain analysis together?
Yes. Looking at both is essential. The time waveform, overall vibration value, and frequency spectrum are derived from the same underlying machine signal but present different information. Reviewing both can provide a more complete view than relying on either one alone.
Does an FFT spectrum identify the fault automatically?
No. A spectrum highlights frequency components and patterns, but those patterns must be interpreted in the context of machine speed, components, construction, load, sensor type, and measurement location.
Is frequency-domain analysis always the better choice?
No. If the goal is routine condition trending or a fast check of overall vibration, time-domain or overall-level measurements may be sufficient. Frequency analysis becomes more valuable when the cause of a change needs to be investigated.
Which method is more useful for rolling element bearing monitoring?
Frequency-domain analysis can help identify frequency components associated with developing rolling-element bearing conditions. However, the quality of the diagnosis depends on the selected sensor, measurement range, sampling, mounting, operating conditions, and correct interpretation of the spectrum.
Better Decisions Start with the Right View
A vibration signal is not just a number. It is a combination of machine behaviors unfolding over time.
Time-domain analysis shows how that signal changes. Frequency-domain analysis separates it into components that can help reveal what is driving the change. Together, they give maintenance and reliability teams a stronger basis for deciding what to inspect, when to intervene, and how urgently to respond.
The objective is not to collect more data for its own sake. It is to capture the right information, view it in the right way, and turn it into a maintenance decision before a developing condition becomes an unplanned shutdown.
Explore Metrix vibration monitoring resources